Alerting
Enterprise feature — requires the
alertingfeature in yourEFFICIENTAI_LICENSE. See Enterprise for licensing details.
What alerting is
Alerting lets you set up automatic notifications when something important happens with your voice AI agents. Instead of manually checking dashboards, you define rules — and EfficientAI notifies you via Slack, email, or both when those rules are triggered.
Think of it as a smoke detector for your voice AI operations. You tell it what to watch (for example, "error rate is above 10%"), and it rings the alarm when something goes wrong.
Quick example
"If the average latency of my Customer Support Agent exceeds 3 seconds over the last 30 minutes, send a Slack notification to #ops-alerts."
Key concepts
Alert
An alert is a monitoring rule. It defines:
- What to measure (metric + aggregation)
- When to fire (threshold + operator)
- How far back to look (time window)
- Who to notify (emails + webhooks)
- How often to notify (frequency / cooldown)
Alert history
Every time an alert's condition is met and fires, an Alert History record is created. This gives you a full audit trail of when alerts were triggered, what the value was, and whether notifications were sent.
Configure an alert
What you configure
- Alert name and optional description
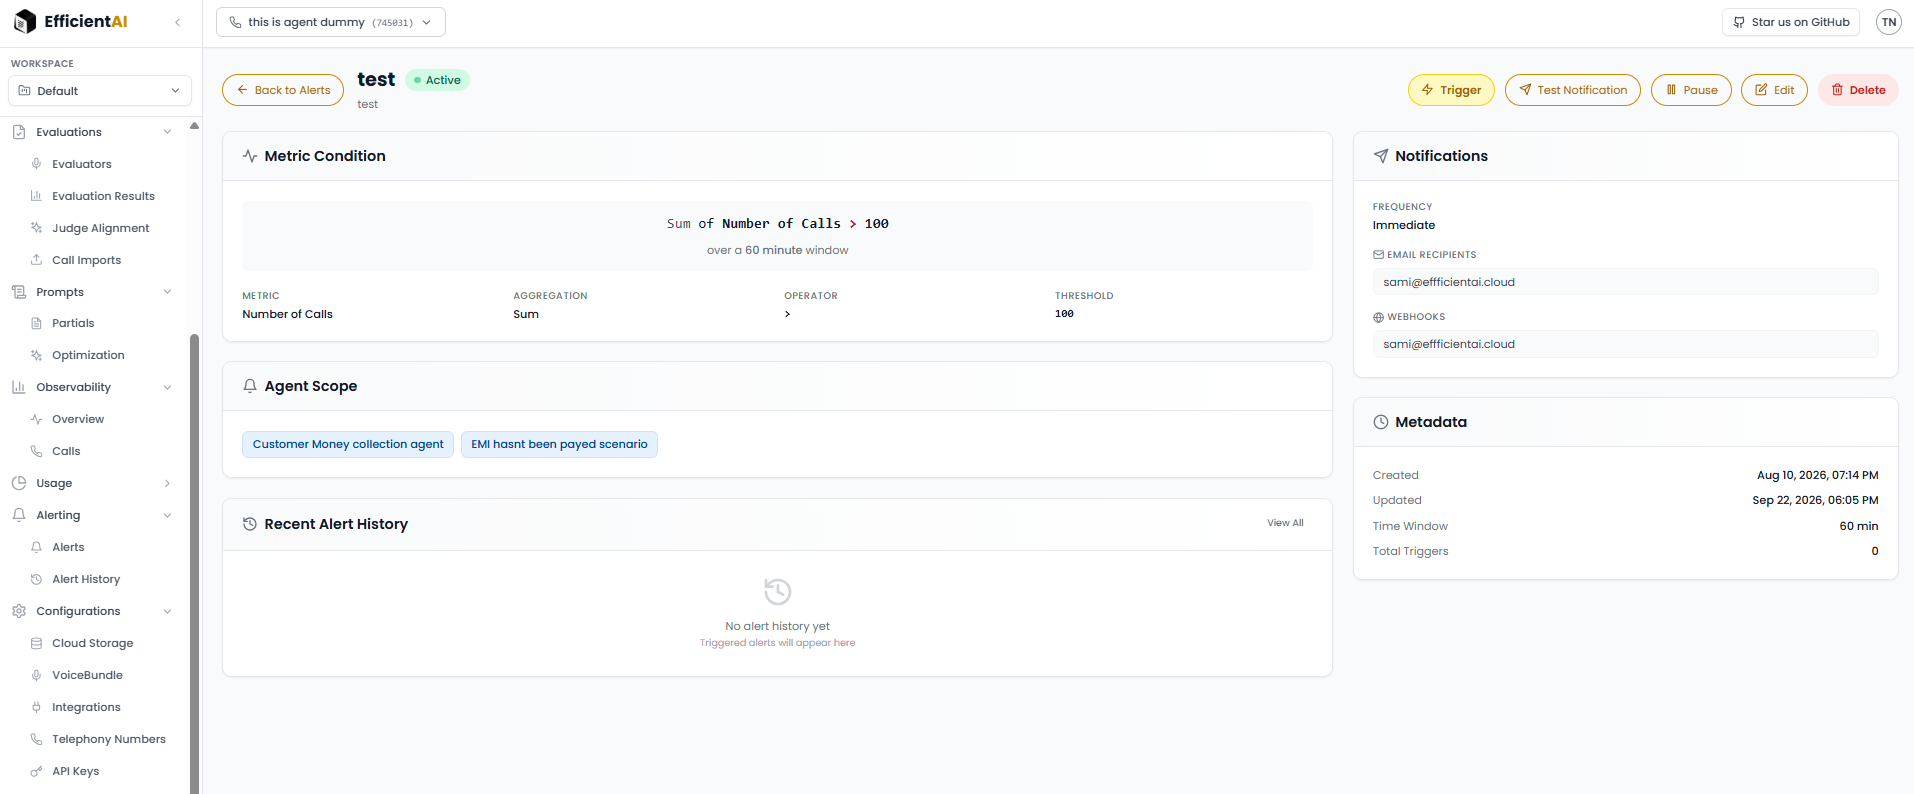
- Metric condition (metric, aggregation, operator, threshold, time window)
- Agent scope (all agents or specific agents)
- Notification channels (email recipients, Slack webhooks)
- Notification frequency (cooldown between repeat notifications)
Recommended flow
- Confirm SMTP is configured if you want email notifications (see Configuration).
- Create a Slack incoming webhook if you want Slack notifications.
- Create the alert from Alerting → Alerts.
- Use Test Notification to verify delivery, then Trigger to validate the condition.
How to set up an alert
- Go to Alerting → Alerts in the sidebar.
- Click Create Alert.
Basic information
| Field | Required | Description |
|---|---|---|
| Alert Name | Yes | A descriptive name, e.g., "High Error Rate - Production" |
| Description | No | Optional notes about what this alert monitors |
Metric condition
| Field | Required | Description |
|---|---|---|
| Metric | Yes | What to measure (see Available metrics) |
| Aggregation | Yes | How to combine values over the time window |
| Operator | Yes | Comparison operator (>, <, >=, <=, =, !=) |
| Threshold | Yes | The value to compare against |
| Time Window | Yes | Minutes of data to look back (e.g., 60 = last 1 hour) |
Example: Average of Latency > 3 over a 30 minute window means: if the average latency across all calls in the last 30 minutes exceeds 3 seconds, fire the alert.
Agent selection
- All Agents — monitors every agent in your organization (default)
- Specific Agents — select one or more agents to scope the alert
Notification settings
| Field | Required | Description |
|---|---|---|
| Notification Frequency | Yes | How often to re-notify if the condition persists |
| Email Recipients | No | One or more email addresses |
| Webhooks | No | Slack incoming webhook URLs |
You must configure at least one email or webhook for notifications to work.
- Click Create Alert. Your alert is now Active and will be evaluated automatically.
Available metrics
| Metric | Value | Description |
|---|---|---|
| Number of Calls | number_of_calls | Total count of calls in the time window |
| Call Duration | call_duration | Duration of calls (in seconds) |
| Error Rate | error_rate | Percentage of calls that resulted in errors |
| Success Rate | success_rate | Percentage of calls that completed successfully |
| Latency | latency | Response latency of the voice AI agent |
| Custom | custom | Custom metric (for advanced use cases) |
Aggregations
| Aggregation | Value | Description |
|---|---|---|
| Sum | sum | Total sum of all values |
| Average | avg | Arithmetic mean of all values |
| Count | count | Number of data points |
| Minimum | min | Lowest value in the window |
| Maximum | max | Highest value in the window |
Notification channels
Slack webhooks
EfficientAI sends rich Slack messages using Block Kit formatting. Each notification includes the alert name, triggered value vs. threshold, timestamp, and agent scope.
- Go to your Slack workspace's Apps settings.
- Create or select an Incoming Webhook app.
- Choose the channel to post to.
- Copy the webhook URL and paste it in the alert's Webhook field.
Email notifications
Email alerts require SMTP to be configured in your EfficientAI deployment. See Configuration for SMTP settings.
Notification frequency
| Frequency | Cooldown | Description |
|---|---|---|
| Immediate | None | Notify every time the alert evaluates as triggered |
| Hourly | 1 hour | At most one notification per hour |
| Daily | 24 hours | At most one notification per day |
| Weekly | 7 days | At most one notification per week |
Alert lifecycle
| Status | Description |
|---|---|
| Active | The alert is being evaluated on every cycle (default) |
| Paused | Temporarily not being evaluated |
| Disabled | Fully disabled |
From the alert detail page you can Pause, Resume, Edit, Delete, Trigger (manual evaluation), or send a Test Notification.
Alert history entries progress through Triggered → Notified → Acknowledged → Resolved.
Automatic evaluation
Alerts are automatically evaluated every 5 minutes by a Celery Beat schedule (evaluate_alerts, routed to the platform queue). Beat only enqueues tasks — you must also run a worker that consumes the platform queue, or evaluations and notifications will not run.
Recommended (starts Beat plus a co-located platform worker):
eai beat --config config.ymlOr run Beat and the platform worker separately:
# Worker for alert evaluation (and other platform tasks)
celery -A app.workers.celery_app worker --queues=platform --pool=threads --loglevel=info

# Scheduler (single replica)
celery -A app.workers.celery_app beat --loglevel=info
A default-queue worker (celery -A app.workers.celery_app worker with no --queues) does not process evaluate_alerts.
Common patterns
Monitor error rate spikes
Metric: Error Rate | Aggregation: Average | Operator: > | Threshold: 5 | Window: 30 minDetect call volume drops
Metric: Number of Calls | Aggregation: Count | Operator: < | Threshold: 10 | Window: 60 minTrack high latency
Metric: Latency | Aggregation: Max | Operator: > | Threshold: 5 | Window: 15 minSee also: Enterprise for licensing and the full product reference at Alerting (products).
Community & contact
- Found a bug or have a feature request? Open a GitHub issue.
- Join our Discord for faster replies!